Metropolitan Family Services FY24 Financials
STATEMENT OF ACTIVITIES
Years Ended June 30, 2024 and 2023
Amounts in 000’s
| OPERATING REVENUE | 2024 | 2023 |
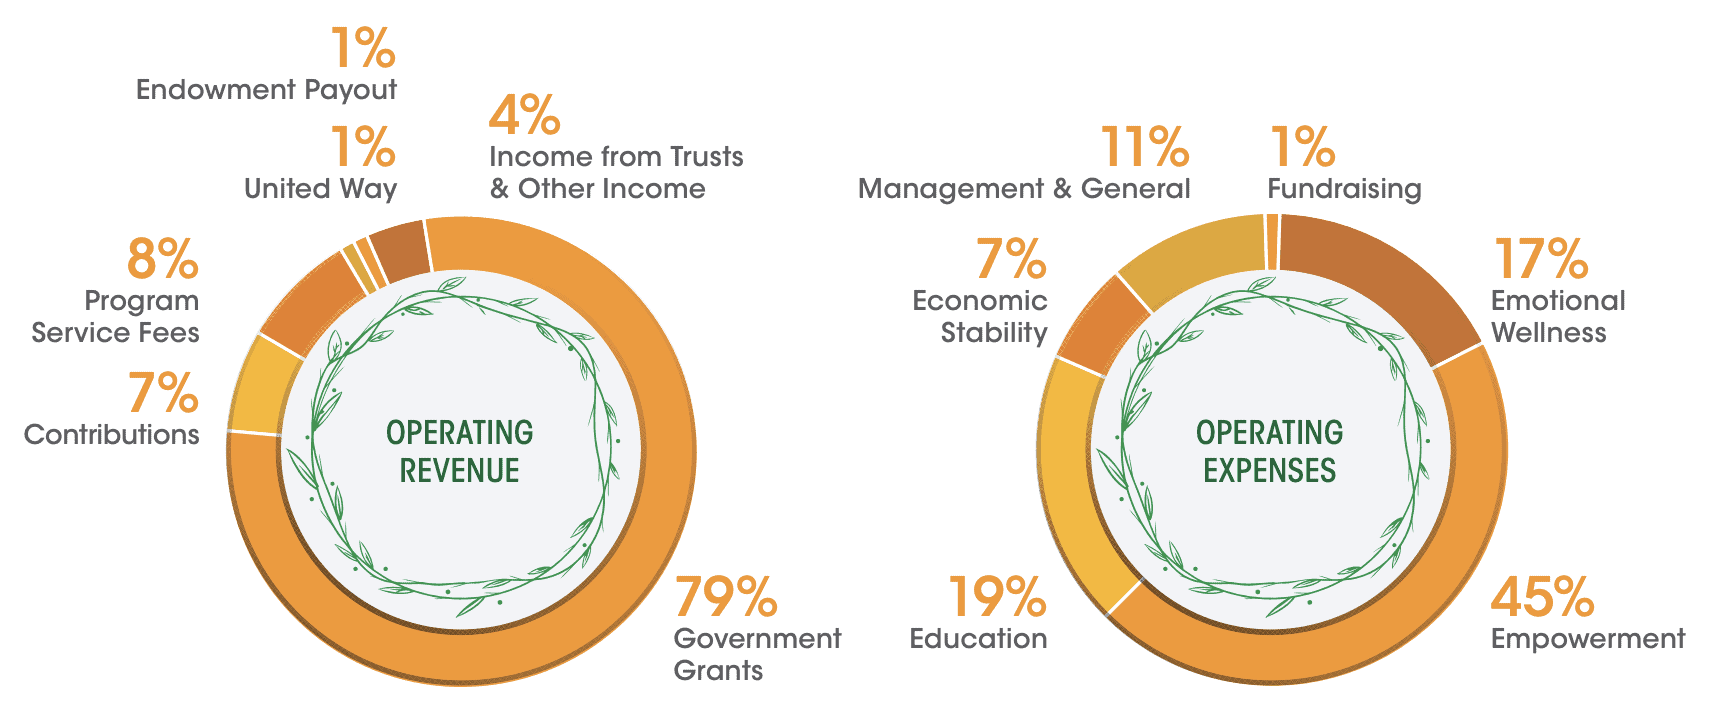
| Government Grants | 120,918 | 99,244 |
| Program Service Fees | 12,775 | 11,146 |
| Contributions | 11,126 | 12,368 |
| United Way | 1,266 | 1,381 |
| Endowment Payout | 1,668 | 1,668 |
| Income from Trusts & Other Income | 6,132 | 3,958 |
| TOTAL OPERATING REVENUE | 153,885 | 129,765 |
| OPERATING EXPENSES PROGRAM EXPENSES | 2024 | 2023 |
| Empowerment | 68,921 | 51,769 |
| Education | 28,421 | 25,982 |
| Emotional Wellness | 26,827 | 26,482 |
| Economic Stability | 10,817 | 9,161 |
| Total Program Expenses | 134,986 | 113,394 |
| Management & General | 16,543 | 13,860 |
| Fund Raising | 2,236 | 2,153 |
| TOTAL OPERATING EXPENSES | 153,765 | 129,407 |
| OPERATING SURPLUS | 120 | 358 |
| OTHER CHANGES IN NET ASSETS | 2024 | 2023 |
| Depreciation & Amortization | (1,739) | (1,218) |
| Net Investment Gains | 2,186 | 2,663 |
| Change in Pension Liability | 69 | 594 |
| Change in Interest Rate Swap | 281 | 778 |
| Inherent Contribution of HACC | 0 | 3,279 |
| Transfer of Assets of I-Grow Chicago | 0 | (2,748) |
| ERC | 4,545 | |
| Capital Grants | 1,800 | 2,175 |
| Change in Restricted Contributions | (1,580) | 1,243 |
| NON OPERATING ACTIVITY | 5,562 | 6,766 |
| TOTAL CHANGE IN NET ASSETS | 5,682 | 7,124 |
| NET ASSETS AT BEGINNING OF YEAR | 85,531 | 78,407 |
| NET ASSETS AT END OF YEAR | 91,213 | 85,531 |
| In-Kind Contributions of Goods and Services | 4,302 | 4,236 |
BREAKDOWN OF EXPENSES
FY24

STATEMENT OF FINANCIAL POSITION
June 30, 2024 and 2023
Amounts in 000’s
| ASSETS | 2024 | 2023 |
| Cash | 8,922 | 15,324 |
| Receivables | 31,144 | 27,946 |
| Investments | 35,942 | 44,259 |
| Interest in Trusts | 18,560 | 17,231 |
| Property and Equipment | 33,420 | 31,690 |
| Lease Asset | 11,245 | 8,783 |
| Other | 2,146 | 1,497 |
| TOTAL ASSETS | 141,379 | 146,730 |
| LIABILITIES AND NET ASSETS | 2024 | 2023 |
| Accounts payable and Accruals | 14,545 | 13,086 |
| Investment Bond | 8,500 | 8,500 |
| New Markets Tax Credits Notes | 10,420 | 10,368 |
| Bonds Payable | 0 | 12,700 |
| Lease Liability | 11,734 | 9,248 |
| Other | 4,967 | 7,296 |
| TOTAL LIABILITIES | 50,166 | 61,198 |
| NET ASSETS | 91,213 | 85,532 |
| TOTAL LIABILITIES AND NET ASSETS | 141,379 | 146,730 |
